Winter smog is returning across the northwestern South Asian plains, but two headline AQI scores do not make a fair city-to-city contest. Punjab’s Environment Protection Agency reported Lahore at 360 in its 4 November update, while an Indian government bulletin recorded Delhi’s CPCB AQI at 350 at 16:00 on 3 November. The numbers belong to different reporting systems and time windows. Behind them is a more useful question: how much of any improvement comes from policy, and how much from weather?
Two readings, two clocks
Punjab’s Environment Protection Agency (EPA) said in its 4 November update that the province-wide average AQI over the preceding 24 hours was 247. Its district list placed Lahore at 360, behind Pakpattan at 393 and Sahiwal at 382, and identified PM2.5 as the primary pollutant across the province. The post did not give a separate clock time for Lahore’s 360, so it should be read as a report-date district figure, not an hourly observation. The provincial average and the Lahore figure are different geographic measures, not two versions of the same average.
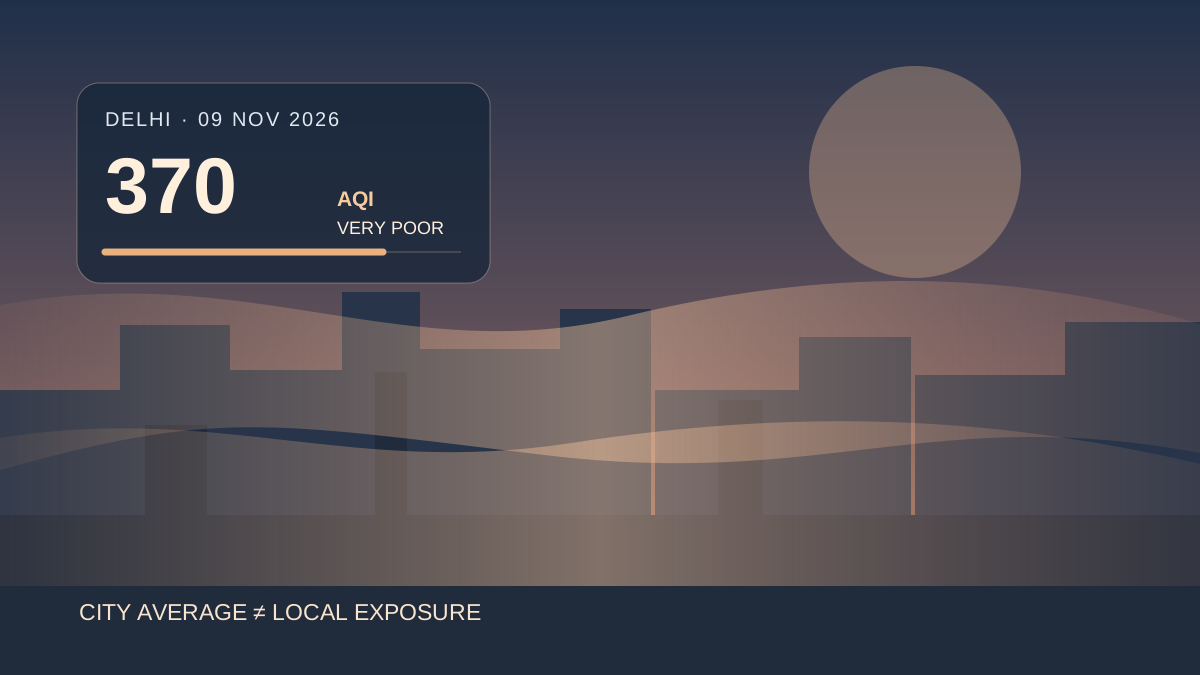
A bulletin published on 4 November by the Indian Institute of Tropical Meteorology (IITM), under the Ministry of Earth Sciences, recorded Delhi’s CPCB AQI at 350 at 16:00 IST on 3 November, in the Very Poor category. It forecast Very Poor conditions for 4 November and Severe air quality for 6–7 November. Those later categories were forecasts, not confirmed readings.
Sources: Punjab Air Quality Report, 4 November 2026 · Air Quality and Weather Bulletin for Delhi, 4 November 2026
An AQI score is not a universal currency
A number called AQI is not a universal unit like degrees Celsius. Punjab’s scale runs from 0 to 500, with 301–400 labelled Very Unhealthy and 401–500 Hazardous. India’s National AQI uses the same broad 0–500 span but labels those bands Very Poor and Severe; its Moderate band also extends to 200, whereas Punjab’s ends at 150. The labels and breakpoints are not interchangeable.
Delhi’s government portal explains that its hourly city AQI is an average of readings from stations reporting in that hour, with each station’s score derived from the highest available pollutant sub-index. Readings update hourly and remain provisional pending checks. Reuters’ 3 November report illustrated the method problem: it cited Delhi at 215 on IQAir and 332 on CPCB, noting that the systems use different scales and methodologies. A score from one feed should not be substituted for another.
Sources: How Delhi’s AQI is calculated · Punjab’s new air pollution dashboard launched to improve monitoring and action · Lahore, Delhi choke as air pollution spikes in parts of South Asia
Lahore’s October improvement claim meets a tougher test
The latest official claims from Lahore point to improvement before the new smog episode. A report by Punjab’s Environment Protection and Climate Change Department, covered by The News on 4 November, said six major pollutants had improved by a net 15% during the first year of its real-time monitoring programme. It also said Lahore’s peak AQI in October 2026 was 28% lower than in October 2025, and that October 2026 had no days above the province’s hazardous threshold, compared with four such days a year earlier. The department said its network had grown to 59 stations measuring six pollutants and seven weather variables.
A separate Pakistan Air Quality Initiative analysis, reported by Dawn on 3 November, gave a more qualified picture. Across 26 monitoring sites, average PM2.5 in October was 27% lower than in October 2025; after accounting for weather, the improvement was estimated at 4%. PAQI also said PM2.5 exceeded Pakistan’s daily limit on every day in October. It attributed part of the unadjusted fall to a deeper nighttime mixing layer, which lets pollution disperse through a larger volume of air. The EPCCD, in the same report, disputed PAQI's reading of the mixing layer, saying ground-based SUPARCO ceilometer measurements showed only a 10-metre rise in the minimum mixing layer, against 25 metres cited by PAQI, and questioned the PAQI assessment's reliability.
The two assessments are not a clean contradiction. One describes a government-reported net change across six pollutants and peak AQI; the other isolates PM2.5 and applies a weather adjustment to a smaller monitoring sample. They should not be treated as identical measures. The distinction matters because a cleaner month can reflect both reduced emissions and more favourable conditions. Dawn reported that PAQI could not isolate the separate contribution of each government measure, so the data do not prove that the policy package caused the full observed decline.
Sources: 15pc improvement recorded in City’s air quality · Lahore’s air quality deteriorates further as Punjab smog worsens
Weather changes exposure before policy can claim credit
Weather is not a side issue in winter smog. Reuters described cold, dense air trapping emissions from vehicles, construction and crop-residue burning across northern India and adjoining Pakistan. Lahore’s district administration had already announced a ban on burning crop residue, garbage, leaves and other waste, warning of legal action for violations. The ban shows that authorities recognise open burning as one target; it does not quantify how much of Lahore’s PM2.5 comes from each source.
Delhi’s Environment Department similarly says winter pollution is shaped by calm conditions, temperature inversions and biomass burning in the National Capital Region, alongside particulate matter and gaseous emissions. That mix helps explain why the same policy can produce different results under different weather. It also cautions against attributing a city’s daily AQI to one source, whether traffic, farms or construction.
Sources: Anti Smog Drive · Lahore, Delhi choke as air pollution spikes in parts of South Asia · Ambient Air Quality
Delhi’s response is tightening as readings rise
Delhi has moved to a higher response level as the season worsens. The Delhi Traffic Police published a Stage-II enforcement advisory on 3 November, asking drivers to keep valid pollution-under-control certificates, follow emission norms and reduce private-vehicle use in favour of public transport. Reuters also reported restrictions covering polluting vehicles, construction activity and coal or firewood use in eateries, alongside expanded public transport. These are active controls, not evidence that air quality has already improved.
In Lahore, EPA Punjab said on 4 November that enforcement teams were checking factories, brick kilns and barbecue points. The district administration’s September anti-smog drive had separately prohibited open burning of crop residue and waste. Enforcement can reduce emissions only if inspections lead to sustained compliance and if other major sources are addressed; a list of raids or bans is an activity measure, not an air-quality outcome.
Sources: Punjab Air Quality Report, 4 November 2026 · GRAP Stage-II Enforcement in Effect Across Delhi · Anti Smog Drive · Lahore, Delhi choke as air pollution spikes in parts of South Asia
The test is what changes after the haze lifts
The next test is whether the improvement survives a change in weather. That requires more than one headline score: consistent station coverage, pollutant-specific PM2.5 and PM10 readings, clearly stated averaging periods, meteorological adjustment, and public records of inspections, violations and penalties. The difference between a 27% raw decline and a 4% weather-adjusted estimate shows why these details are not technical decoration.
Lahore’s 360 and Delhi’s 350 should not be treated as a tie or a ranking. One is a city figure in a Punjab EPA report with no stated clock time; the other is a CPCB reading for Delhi at 16:00 IST on 3 November. The more important comparison is whether both cities can reduce exposure across a full season, not merely post a better number on a favourable day. Winter smog may be seasonal, but accountability for cleaner air cannot be.
Sources: Punjab Air Quality Report, 4 November 2026 · Air Quality and Weather Bulletin for Delhi, 4 November 2026 · How Delhi’s AQI is calculated · Punjab’s new air pollution dashboard launched to improve monitoring and action · 15pc improvement recorded in City’s air quality · Lahore’s air quality deteriorates further as Punjab smog worsens