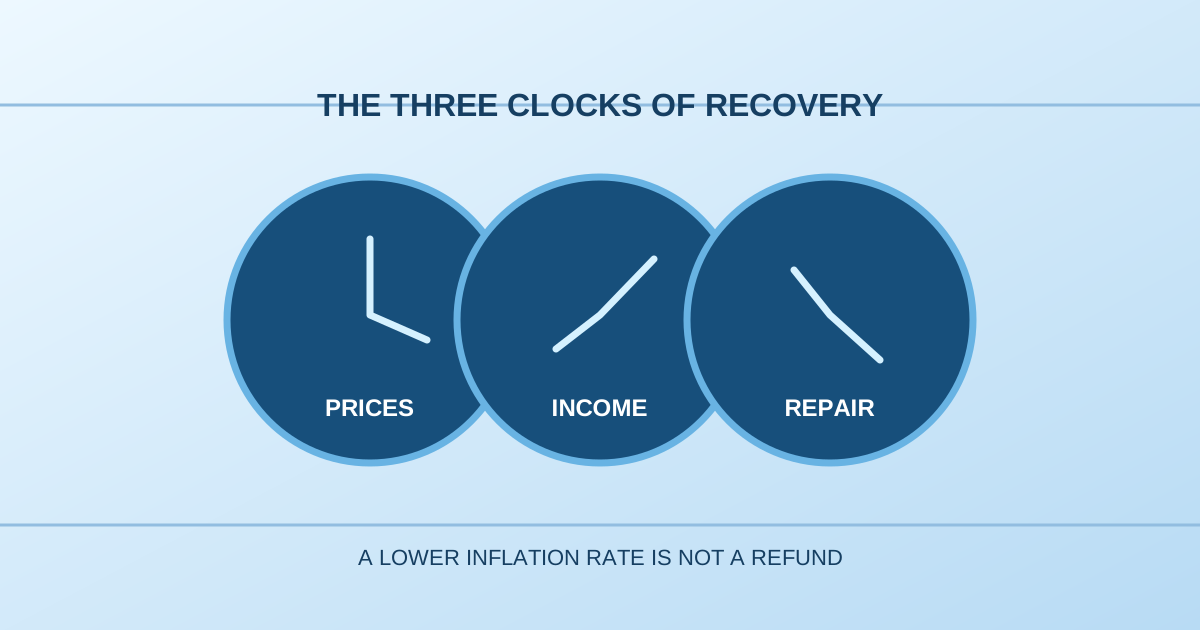
The headline arrives before the relief does. A family hears that inflation has slowed, opens the week's receipts, and discovers that the grocery bill is still larger than it remembers. Meanwhile an economist points to a genuinely improving price index. They may sound as though they disagree, but they are not necessarily measuring the same thing. The statistic asks how quickly a representative set of prices is changing. The family asks what remains after paying the bills, whether another month of work is secure, and whether it can afford an unforeseen setback. Argentina's recent figures make this puzzle especially vivid, but the distinction is useful far beyond one country or government. Our argument is that recovery cannot be declared from a single dial. It unfolds across three clocks—prices, income and work, and the repair of financial security—and those clocks rarely move in lockstep.
The clock that slows but does not run backward
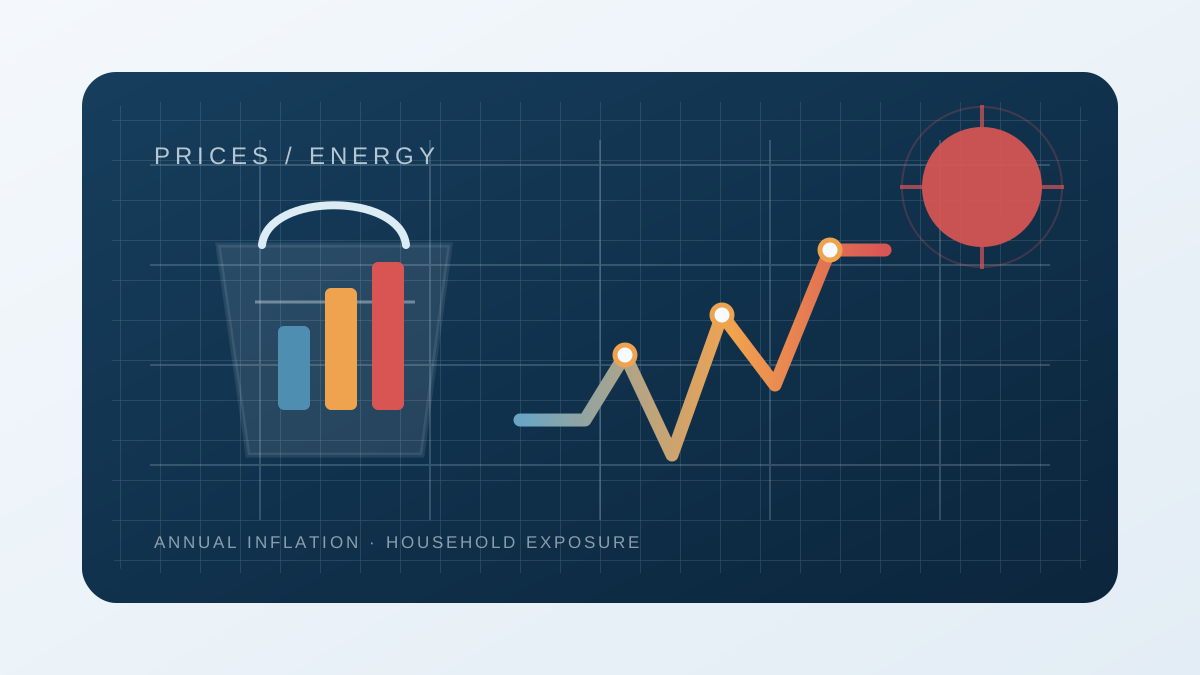
Inflation measures a rate of change, not a refund for the money households have already spent. Suppose a hypothetical shopping basket rose from 100 to 150. Another month of 2% inflation makes that basket cost 153. Prices are rising more slowly than in an earlier crisis, yet they have not returned to 100. Disinflation is not the same as deflation, and neither automatically restores lost purchasing power.
Argentina's national statistics agency, INDEC, reported a 1.9% month-on-month consumer price increase for September 2026, compared with 1.7% in August. September's monthly rate therefore rose relative to August; it must not be described as a month-to-month decline. The wider question here is the distinction between a period of disinflation and the separate lived recovery of household purchasing power. But it is a measure of the movement of a broad index between two months, not a direct measure of whether a family's salary has caught up with prices over several years.
That is our first clock: the price clock. A slower climb can make planning easier, reduce uncertainty and improve the conditions for investment. It does not tell us how far individual households still stand from the standard of living they once had. Treating a favorable rate as a completed recovery asks a speedometer to tell us how much money is left in the fuel tank.
A rate can fall even while the underlying level continues rising. That elementary distinction has unusually large consequences in political rhetoric. Imagine an annual price-change rate falls from 60 percent to 20 percent. That would be a substantial improvement in the pace of inflation; it would not mean a basket that became expensive in the first period is twenty or forty percent cheaper now. If the basket began at 100 and rose to 160 during the first year, an additional 20 percent increase would bring it to 192 in the second. Each percentage describes growth from its own starting level. The example is arithmetic, not a description of Argentina's actual inflation path. Its purpose is to show why a slowing percentage and a still-painful price level can coexist without contradiction.
Nor does a reported monthly change mechanically predict a full year's inflation. A one-month increase of 1.9 percent would compound to roughly 25.3 percent if—and only if—the same rate repeated for twelve consecutive months. Actual monthly increases vary, index composition changes, and policy or exchange-rate shocks can alter the path. Treating one observation as a forecast would transform a measurement into a speculation. Equally, interpreting a year-on-year rate and a month-on-month rate as interchangeable ignores their different bases. A reader should know which clock, which interval and which reference basket a number describes before deciding what its movement means.
Price stability is nonetheless a powerful social good. When tomorrow's prices become more predictable, families may be able to compare offers instead of racing to buy before the next increase. Workers can negotiate contracts with a clearer understanding of what a nominal pay rise will purchase. A small business can plan inventory without having to guess whether restocking costs will jump before customers pay. These are plausible benefits of greater predictability, not measured outcomes of the particular month cited here. A serious critique of recovery narratives should acknowledge this upside; otherwise it merely reverses the exaggeration it opposes.
One more distinction matters: people remember losses, while indexes record changes. A family that had to sell an asset to cover a past emergency is not made whole by a slower increase in rent or food prices. The price index does not claim to account for that loss. Asking it to do so is like asking a thermometer to report whether the roof was repaired after a storm. The thermometer can be accurate and still leave the consequential question unanswered. That gap is the reason to build a broader diagnostic rather than to denounce the instrument.
Sources: Consumer Price Index, September 2026
The household never buys the national average
No household purchases the exact national consumption basket. One family rents its home while another owns it. One relies on public transport; another has no choice but to drive. A household caring for an older relative may devote a far larger share of income to health-related costs than the average family. A national index is useful for describing an economy; it is not a biography of every person inside it.
Imagine two fictional households earning the same income. The first has a fixed housing payment and predictable working hours. The second faces periodic rent increases, unpaid hours and long commutes. Both read the same inflation figure. Only one may have room to rebuild savings. This is a conceptual comparison, not an interview, survey or claim about how most Argentine households behave.
When people argue that statistics contradict lived experience, they often compare answers to different questions. An inflation statistic can be measured correctly while an individual family's account of strain is also accurate. The revealing question is not which one to believe; it is where the family's costs, earnings and risks differ from what the aggregate number can capture.
Consider a transparent, entirely fictional budget. Household A receives 1,000 units of take-home income each month, spends 800 on essentials and has 200 left for saving, repairs or discretionary purchases. Later its income rises five percent to 1,050 while the essentials bill rises fifteen percent to 920. The household still has a positive margin—130—but that margin has fallen by 70, or thirty-five percent. Even if the rate of price growth subsequently slows sharply, the earlier reduction in discretionary room remains. An identical national inflation figure cannot reveal that change unless we also observe earnings, expenditures and the household's starting position.
Now give Household B the same 1,050 of income and the same broad national inflation environment, but assume its housing cost is fixed for the year and its transport costs are lower. If its essentials amount to 760, it retains 290. Nothing in this fictional comparison proves which family resembles the typical Argentine household; no survey is implied. Rather, it dramatizes an arithmetic truth: the same percentage change in a common index is not the same budget event for everyone. A political promise framed around the national average becomes especially vulnerable when it forgets variation in rent, household size, debt, access to public services and the timing of pay adjustments.
The relative importance of expenses can also change over a lifetime. A young renter saving for a deposit, a parent buying childcare and an older person managing regular medical expenses face different baskets and different risks. Not every costly category needs to rise faster than the average for these differences to matter. A household with almost no remaining margin is more vulnerable to even an average-sized increase than a family with a substantial financial buffer. Distribution is therefore not a decorative footnote to the headline; it shapes the very meaning of resilience.
A useful way to examine an improvement in an aggregate economic indicator is to ask two additional questions: whose basket or income is represented, and whose circumstances could reasonably depart from that average? These questions do not invalidate the aggregate. They stop us from converting the aggregate into an assertion about every person it includes.
Income and work have their own timetable
A family moves forward when the resources available to it grow relative to the costs it must bear. That might mean higher wages, more paid hours, steadier employment, lower debt service or a smaller share of spending devoted to necessities. None of these developments is logically guaranteed by slower inflation. A worker can maintain the same hourly rate yet lose shifts. A retailer can face fewer customers even if the currency becomes more predictable.
INDEC reported that Argentina's August 2026 supermarket sales at constant prices were 3.7% below August 2025. Its monthly economic-activity estimate for August was 1.7% lower than a year earlier, while increasing 0.1% compared with July on a seasonally adjusted basis. These figures refer to different indicators and comparison periods. They do not demonstrate that a particular policy caused weak consumption or that every sector suffered.
They do, however, illustrate the limits of a single macroeconomic headline. Our second clock is the income-and-work clock. Readers should ask whether real earnings, hours worked and job security are improving, and for whom. A recovery cannot be experienced equally if its benefits reach exporters, asset owners or a few growing sectors before reaching workers whose incomes depend on domestic demand.
The wages side illustrates a second measurement trap. INDEC's August 2026 salary index registered a 2.7 percent month-on-month increase, reflecting different reported changes for registered private employment, public employment and nonregistered private employment. That is informative, but it is not the same as tracking the take-home pay of every worker; nor can it be compared directly with September's CPI observation as though both referred to the same month. To assess real wage growth one must align the time period and use the relevant price deflator, then consider whose wages and hours are covered. The distinction between an index of reported pay rates and the cash a precarious worker receives is material.
Suppose a worker's hourly wage increases six percent while hours worked fall fifteen percent. Even before considering taxes or changes in prices, the income earned from that job would be about 90.1 percent of the original amount, because 1.06 multiplied by 0.85 equals 0.901. The example is hypothetical, but the arithmetic explains why a favorable pay-rate headline need not translate into an improved monthly budget. Conversely, a worker with steady hours and a wage increase exceeding the relevant rise in living costs may experience a genuine gain. An intellectually honest essay must leave room for both outcomes.
Retail numbers require equal caution. A fall in supermarket purchases at constant prices could reflect weaker household demand, but it could also coexist with purchases shifting toward other sales channels, stores or kinds of spending. One retail series cannot tell us how total household welfare changed. Even a broad economic-activity estimate, though more comprehensive, reports output rather than the distribution of gains or the quality of working conditions. Neither statistic establishes a causal explanation for the other. Their value here is to demonstrate that aggregate stabilization and activity indicators can signal different things at different moments.
A more convincing measure of the income clock would follow a consistent panel of indicators rather than a single striking figure: real wages by sector where available, hours worked, employment participation, job security, income by household group and spending on essentials. Ideally those indicators would be compared with their own pre-shock baselines. Such an exercise is a research agenda, not one we can claim to have completed from a handful of INDEC releases. Recognizing the difference between a useful agenda and an accomplished study is part of honest original analysis.
Sources: Survey of Supermarkets, August 2026 · Monthly Economic Activity Estimate, August 2026 · Wage Index, August 2026
The strongest defense of stabilization is not a guarantee of recovery
An honest argument must take stabilization seriously. Persistent and unpredictable inflation distorts wages, savings, contracts and investment. A government that slows price increases may have created a necessary condition for more durable growth, even if some households face painful adjustments in the meantime. It would be intellectually lazy to dismiss that achievement simply because hardship has not disappeared.
But a necessary condition is not a sufficient condition. Restoring predictability does not immediately recreate a business's customer base, repair damaged household balance sheets or give a laid-off worker a new job. The more credible argument for stabilization is that it may open the door to improvement; the weaker argument is that the door having opened proves that everyone has walked through it.
The opposite shortcut is flawed as well. A decline in retail sales is not, on its own, evidence that stabilization caused the decline or that an alternative policy would have produced a better outcome. That judgment requires a counterfactual, sector-level evidence and careful attention to taxes, credit conditions, spending choices and international shocks. The argument here concerns how to read recovery, not a causal estimate of any single government's policies.
Political debate would improve if each camp stated what evidence could change its mind. Supporters of stabilization should ask when rising stability translates into real household gains. Critics should explain which costs arise from necessary adjustment, which from avoidable policy design and which from circumstances beyond domestic control. A useful argument should survive a fair description of its strongest opponent.
Why does this distinction matter politically? A stabilization program can improve the economic environment while imposing costs that fall unevenly across people and time. For instance, a reduction in subsidies may change public finances and the price households pay for particular services; tightening financial conditions may affect investment as well as inflation expectations. These are possible channels found in many policy debates, not a causal attribution to any specific Argentine measure. Whether a trade-off was justified requires assessing both the alternatives and the distribution of burdens, not simply applauding or condemning the endpoint.
The strongest pro-stabilization thesis is dynamic: reducing monetary instability may improve the conditions under which businesses invest, lenders extend credit and people sign longer contracts. Benefits that take time to materialize cannot necessarily be judged from one month's retail series. But this also imposes an obligation on advocates. They should specify which improvements are expected, over what horizon, in which sectors, and how they would recognize failure. If an argument cannot identify any observation that would count against it, it risks becoming an endlessly deferred promise rather than a testable claim.
The strongest skeptical thesis is distributional: people with minimal savings or insecure jobs may bear a larger adjustment cost than those who can absorb a temporary contraction. That concern deserves direct attention. Yet critics also need a counterfactual. Would an alternative policy have delivered faster real-income gains without reviving price instability or causing another kind of damage? The answer cannot be assumed from the visible hardship alone. Responsible analysis can say both that hardship matters and that the practical policy counterfactual is uncertain.
In the absence of a credible counterfactual, we can still ask useful questions. Who gains from greater price predictability first? Which households face a short-run liquidity squeeze? What institutions, contracts and social protections help bridge the transition? What public metrics would show that the adjustment is becoming less unequal? This turns a shouting match about whether the economy is 'good' or 'bad' into a set of questions that evidence might eventually settle.
The clock that measures the time to feel safe again
Even when a paycheck improves, a family that exhausted its savings may first rebuild an emergency fund rather than spend. A small business may repay overdue suppliers before hiring. A person who fears a future income shock may delay a move or a training course. These are plausible mechanisms, not asserted findings about the behavior of the average Argentine household. The recovery of financial confidence can lag behind both price stability and measured wage growth.
The scale of hardship deserves precise description. INDEC reported that 32.3% of people in the 31 urban agglomerations covered by its first-half 2026 survey were below the measured income-poverty line. This is a specific urban sample and period, not a November nationwide headcount and not a measure of subjective confidence. The figure tells us something important about income relative to a defined threshold; it does not identify a cause by itself.
That brings us to the third clock: repair. Households need time to restore savings, confidence, predictable employment and the ability to plan beyond the next bill. A price index can improve before a family can replace a worn-out refrigerator without borrowing. The distance between those moments is a meaningful part of economic life, not a statistical inconvenience to be dismissed.
The three-clock test is an analytical framework, not a validated quantitative index. Check the price clock for stability, the income-and-work clock for real gains, and the repair clock for restored buffers against shocks. These clocks can run at different speeds, and the available official data do not directly measure all three. The framework is useful precisely because it highlights what the headline alone leaves unanswered.
A persuasive recovery eventually becomes visible in ordinary decisions: buying groceries without constant repricing, replacing a broken appliance, planning education or starting a business without assuming that everything will change next week. Slower inflation may be the start of that journey. Treating it as the destination impoverishes public debate and does little to help the people still walking.
Financial repair is more than a psychological afterthought. A household may leave poverty by the measurement threshold and still have no emergency savings. A business may record higher revenue yet remain exposed to a late payment from its largest customer. A worker may recover a previous salary while carrying debt incurred during the crisis. These cases make the repair clock conceptually distinct from current income, though not wholly independent of it. Repair requires a stock of resources to improve, not only a flow in the latest pay period.
That stock-versus-flow distinction provides another hypothetical illustration. Two families have identical current incomes and expenses, leaving each with 100 units of monthly surplus. One has 1,000 in accessible savings; the other owes 1,000 in high-cost debt after an earlier emergency. The same new surplus has different consequences: one can plan and absorb shocks, while the other may need many months merely to regain a neutral position. We cannot infer these balance sheets from the official CPI or poverty rate. The absence of such information is precisely why a confident claim about lived recovery should be qualified.
The third clock is also difficult to measure directly. Consumer confidence surveys, arrears, household debt burdens and emergency savings would illuminate different aspects, but none perfectly captures a person's sense of safety. Some people save more because conditions improved, and others save because they are frightened of the future; the same behavior can carry opposing meanings. This is a limitation of the concept, not a reason to abandon it. It is a reminder to combine indicators with explicit hypotheses about the behavior they might reflect.
Sources: Poverty, first half of 2026, 31 urban agglomerations
A thought experiment: what the three clocks predict
Imagine a fictional economy that experiences several years of rapidly rising prices, followed by a credible stabilization. In the first six months after the turning point, the monthly inflation rate falls. Companies, however, remain cautious about hiring, household wages adjust at different times, and many people who depleted savings are still paying off their debts. The price clock clearly improves. The income clock improves for some households but deteriorates for others; the repair clock barely moves. Under our framework, it is reasonable to call this macroeconomic stabilization, premature to declare a universal household recovery, and inaccurate to say that nothing has improved.
Now suppose the next twelve months bring real wage gains, more stable paid hours and improving demand across sectors. Some households begin to rebuild savings. Price predictability remains intact. The framework would record progress on all three clocks, while continuing to ask which groups are being left behind. It would also avoid confusing a level with a trend: income growing faster than prices for a year does not necessarily restore purchasing power lost during an earlier multiyear crisis. The relevant baseline matters. A policymaker choosing a convenient start date can make almost any improvement look larger than it feels.
Finally, imagine prices becoming less stable again, even as some well-paid sectors prosper. A top-line income statistic could improve while ordinary households face renewed uncertainty. The three-clock approach would flag a mixed, fragile recovery rather than celebrate the income number alone. These thought experiments are not Argentine forecasts; they are controlled comparisons designed to reveal how the proposed lens responds when the underlying mechanisms change. A good framework must be able to say 'mixed evidence' rather than manufacture an unambiguous verdict.
The most revealing feature is the order of arrival. Price stabilization may create an opportunity for income recovery; income recovery may create an opportunity for rebuilding resilience. But these are contingent pathways, not a universal sequence. In some sectors wages can recover early; in others debt repair can improve because families receive transfers or restructure obligations even before earnings rise. The model's three clocks are analytic categories, not a rigid theory of stages.
What would disprove this argument—and what evidence should we look for?
It is easy to build a metaphor that seems able to explain every outcome. That would be an editorial failure. Our narrow central claim is testable in principle: an improvement in the inflation rate alone is insufficient to establish a broad improvement in household welfare. To challenge the practical usefulness of the three-clock approach, one could show that a sufficiently well-designed existing indicator already captures prices, real income, employment security and household buffers without the distinctions adding any clarity. One could also show that the distinctions frequently cause readers to misinterpret genuinely representative data or obscure better direct measures of welfare.
A more ambitious research project would specify a consistent time series, chosen before examining its results. It would compare annual and monthly price changes with sector-specific real wages and paid hours, measures of employment risk, and indicators of household savings or debt. It would examine different income groups rather than let a single average impersonate the distribution. Where data permit, it would look at how these patterns differ by region and household circumstances. Then it would test whether the three clocks identify turning points missed by conventional summaries. Without that exercise, our framework remains a proposal for editorial questioning, not a validated empirical finding.
An important weakness is that the clocks may overlap: insecure work can cause savings to disappear, while weak savings can shape labor choices. Another is that measuring confidence is harder than measuring an observable price. A third is that macroeconomic adjustment may improve welfare in ways that our chosen indicators miss, including avoiding future harm. Those limitations should make us more careful, not more dogmatic. The model ought to be revised if it repeatedly yields misleading impressions; a publication's intellectual assets gain credibility by surviving correction, not by being treated as permanent doctrines.
When a politician, investor or commentator declares that recovery has arrived, readers can ask a small set of questions. Has price growth become more stable, and over what period? Have earnings and employment conditions improved in real terms, and for which groups? Can ordinary households rebuild buffers against the next shock? What evidence would change the answer? These questions separate measurable claims from interpretation and make competing accounts easier to assess. The framework does not tell readers which party to support or which policy to choose; it clarifies the evidence on which such judgments can be based.
A lower inflation rate can be a serious achievement without being a refund for years of lost purchasing power. That sentence is not a verdict on Argentina's entire economic program. It is a caution against a habit of public argument: using one accurate measurement as a substitute for the larger experience it cannot contain. A society becomes more capable of judging progress when it can acknowledge gains without erasing costs, and acknowledge hardship without denying gains. The three clocks are offered as a way to ask that harder, fairer question—and as an idea that readers, researchers and future evidence are invited to challenge.