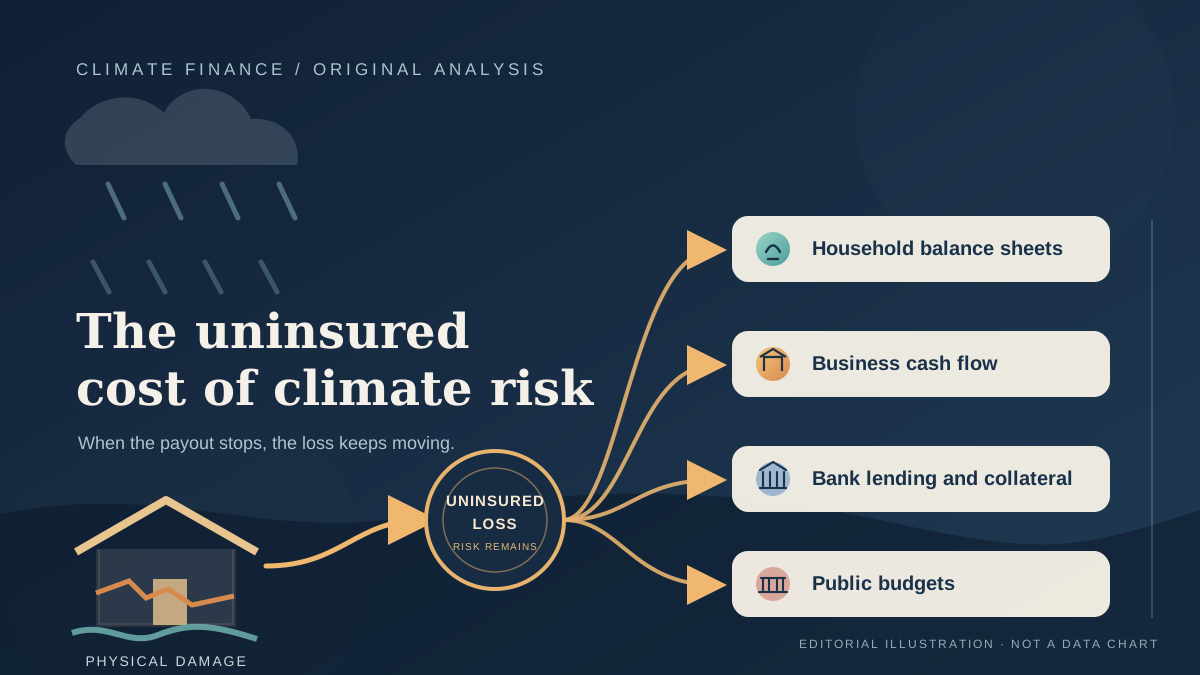
A disaster creates two losses at once. The first is physical: a flooded home, damaged machinery, a washed-out road or a field that cannot produce. The second is financial: the money needed to repair the building, replace inventory, pay workers while operations stop and keep a loan current when income has fallen. The physical damage may happen in a day. The financial burden can travel through an economy for years. That is why the warning in European Central Bank President Christine Lagarde’s 4 November 2026 article matters. She wrote that historically only about a quarter of catastrophe losses in Europe had been covered by insurance. Her point was not simply that too few households buy a particular product. It was that uninsured disaster costs can land on households and businesses first, then reach banks and public budgets when recovery stalls. [1] The insurance protection gap is generally the part of economic losses that insurance does not cover. But it is not one universal statistic. A share of insured losses is not the same thing as the share of people who hold a policy, and a figure for weather-related asset damage is not automatically comparable with a figure for all natural catastrophes. Before asking what the gap means for Europe’s economy, it is necessary to be precise about what is being counted.
Three percentages, three different measuring exercises
The ECB’s climate-insurance explainer provides a historical chart that helps place Lagarde’s headline in context: it presents an average share of insured economic losses from natural-catastrophe events in Europe over 1980–2023. The chart identifies the EIOPA protection-gap dashboard and the European Environment Agency’s CATDAT data as its sources. Lagarde’s 4 November article repeats the conclusion in plain language: roughly one quarter of catastrophe losses had been insured over that historical period. [1] [2]
A second figure comes from the EEA’s updated indicator. For 1980–2024, it estimates that less than 20% of total losses from weather- and climate-related extremes were privately insured. The indicator covers EEA member countries—the 27 EU Member States plus Iceland, Liechtenstein, Norway, Switzerland and Türkiye—while its headline aggregate for total economic losses focuses on the EU-27. It is a private-insurance measure, not simply a count of all public and private risk-sharing arrangements. [6]
The EEA figure also has a narrower hazard definition. It counts meteorological, hydrological and climatological events, but excludes geophysical hazards such as earthquakes and volcanoes because they are not treated as directly driven by climate change. It records direct losses to infrastructure and physical assets, not indirect costs such as lost productivity, health-care costs or the wider effects of disrupted supply chains. Within the EEA series, insurance coverage varies sharply by hazard: more than 35% of meteorological-event losses were insured, compared with around 15% for hydrological events and slightly more than 10% for climatological events such as heatwaves, wildfires and droughts. [6]
The third figure is EIOPA’s estimate. Its 10 November 2025 report, *The Dashboard on Insurance Protection Gap for Natural Catastrophes in a Nutshell*, says that around one quarter of losses in Europe were insured over 1980–2024. The dashboard brings together historical economic and insured-loss data and insurance information from 30 European countries. Its detailed historical section, however, explicitly refers to all perils in the EEA. It identifies Italy’s earthquake losses, Italy’s flood losses and Germany’s flood losses as the three largest sources of uninsured losses; together they account for about 43% of the uninsured total. [3] [4]
That detail matters. The EIOPA dashboard is a natural-catastrophe framework that includes earthquakes as well as floods, windstorms and wildfires. Its 2025 technical description says historical estimates draw on EM-DAT, CATDAT, national schemes and data supplied by national supervisors. It also warns that the methods used to collect historical losses are not aligned across sources and that significant gaps remain, especially for insured losses. The report’s introductory language refers to extreme weather and climate-related events, while its historical breakdown includes all perils. Its headline quarter should therefore be described as a broad natural-catastrophe dashboard estimate, not silently relabelled as a climate-only private-insurance statistic. [3] [5]
The three percentages are not evidence that Europe’s coverage fell from 25% to below 20% in one year. They differ in period, hazard scope, geography and the treatment of private versus broader insurance arrangements. The ECB’s 1980–2023 chart, EIOPA’s 1980–2024 natural-catastrophe dashboard and the EEA’s 1980–2024 weather-and-climate indicator answer related but not identical questions. The responsible conclusion is not to choose the most dramatic number. It is to keep the definitions attached to each number.
Sources: A warning from Europe's hot summer · The climate insurance protection gap · The Dashboard on Insurance Protection Gap for Natural Catastrophes in a Nutshell · Dashboard on insurance protection gap for natural catastrophes · Technical description — dashboard on insurance protection gap for natural catastrophes · Economic losses from weather- and climate-related extremes in Europe
The loss becomes an economic problem when recovery slows
The scale of the underlying damage is already substantial. The EEA estimates that weather- and climate-related extremes caused €822 billion in direct economic losses to assets in the EU-27 between 1980 and 2024, measured in 2024 prices. More than €208 billion of that total occurred in 2021–2024. These are direct asset losses, not the value of uninsured claims and not a complete measure of the wider economic cost. The indicator excludes indirect losses, which means it does not count every production delay, income loss or supply-chain effect that may follow a disaster. [6]
The same 4 November ECB article also points to nearly 12% of euro-area economic output being exposed to risks linked to insufficient flood protection. The underlying ECB analysis estimates nearly 12% of output at risk from degraded flood protection under a modelled one-in-100-year event scenario. That is a nature-value-at-risk estimate, not a prediction that 12% of GDP will be lost, not an annual loss rate and not another measure of the insurance gap. It illustrates how physical exposure can extend beyond the buildings that carry an insurance policy. [1] [12]
Insurance matters because it can provide cash when the affected household or company is least able to raise it. A payout can fund repairs, replace equipment, restore stock and help a business reopen without forcing it to exhaust savings or borrow at the moment its collateral and revenue are weakest. The value is not only the eventual amount paid. It is also the timing: reconstruction can begin sooner, and productive capacity can return sooner.
An ECB Working Paper, *Climate Change, Catastrophes, Insurance and the Macroeconomy*, tests this relationship using several thousand disaster events across 47 developed and middle-income countries between 1996 and 2019. Its authors find that higher insurance coverage is associated with less severe macroeconomic consequences. As an illustration, a catastrophe causing damage equivalent to 1% of GDP is estimated to reduce GDP growth by around 0.2 percentage points in the quarter of impact; where a high share of damage is insured, the initial fall may be averted. This is a cross-country empirical result, not a forecast for Europe or proof that insurance alone caused the difference. [10]
The mechanism is straightforward but easily missed in headline loss figures. A damaged factory is not just a damaged building. Until it is repaired, it may produce less, delay deliveries and reduce the income of suppliers. A household whose home is damaged may divert money from consumption, education or investment into reconstruction. If borrowing is difficult, repairs can be delayed even when the asset is worth restoring. The longer that delay lasts, the more a one-off physical shock can become a continuing output shock. [9] [10]
Sources: Economic losses from weather- and climate-related extremes in Europe · A warning from Europe's hot summer · Nature at risk: Implications for the euro area economy and financial stability · Towards a European system for natural catastrophe risk management · Climate change, catastrophes, insurance and the macroeconomy · Policy options to reduce the climate insurance protection gap
The uninsured loss travels across balance sheets
The first balance sheet to absorb an uninsured loss is usually the one closest to the damaged asset. A household may lose savings, take on debt, postpone repairs or live with a lower-value property. A small business may have to replace equipment and inventory while continuing to pay rent, wages and suppliers. Insurance does not prevent the flood or drought, but it can stop the full cost of rebuilding from being concentrated on the person or firm that happened to be in the path of the event.
The next balance sheet may belong to a bank. If a borrower’s property or business is damaged, the value of collateral can fall while the borrower’s capacity to repay weakens. A firm that cannot restart may miss loan payments; a household that must finance repairs may become more vulnerable to a later income shock. The ECB and EIOPA’s 2024 joint paper identifies these channels directly: uninsured catastrophe losses can reduce collateral values, increase borrower default risk and prolong supply-chain disruption. Banks may then face lower credit quality and losses on their own balance sheets. [9]
The public balance sheet is often the next stop. Governments are expected to provide emergency relief to affected households and firms and to rebuild public infrastructure such as roads, bridges and water systems. After a disaster, that support may be financed by raising taxes, reallocating money from other programmes or issuing debt. These choices can be justified and necessary. But when the liability is not planned in advance, recovery competes with other public priorities and the fiscal cost can arrive when tax revenue and economic activity are already under pressure. [9] [11]
This is the balance-sheet relay: physical damage begins in one place, but the financial burden moves. A household absorbs what it can; a business delays investment; a bank reassesses credit; a government fills some of the remaining gap. The loss has not disappeared because no insurer paid it. It has changed owner, timing and form. A statistic about insured losses is therefore also a partial map of where the remaining risk may accumulate.
Sources: Towards a European system for natural catastrophe risk management · Climate change, catastrophes, insurance and the macroeconomy · Policy options to reduce the climate insurance protection gap
A protection gap can also be an affordability gap
Low insurance uptake is not simply a story about consumers failing to understand risk. EIOPA’s 2025 consumer survey involved 25,846 online interviews with adults across the EU, with fieldwork conducted from 14 to 22 May. In a March 2026 discussion of the results, EIOPA said that only 17% of respondents held coverage for property damage caused by natural catastrophes. That is a survey measure of people reporting a form of cover; it is not the share of disaster losses that insurance paid, and it should not be compared directly with the 20% or 25% loss-based figures. [7] [8]
EIOPA’s demand-side analysis identifies several barriers: consumers may regard cover as too expensive, may not understand its cost or scope, and may expect the state to compensate them after a disaster. Those are different problems and require different responses. Clearer policy information may address confusion, but it cannot make a premium affordable. Targeted help with premiums may improve access, but it cannot make a property safe from repeated flooding. And an expectation of unconditional public rescue can weaken the incentive to arrange cover or reduce exposure before an event. [8] [11]
Risk-based pricing creates a difficult trade-off. If premiums reflect the probability and likely cost of damage, they can encourage safer construction, better maintenance and investment in adaptation. But in a high-risk area, a fully risk-based premium may be beyond the means of the household or small business that needs cover most. If premiums are suppressed across the board, the underlying risk does not vanish; it may reappear as insurer losses, public subsidy or a future withdrawal of coverage. If insurers instead raise prices sharply, narrow exclusions or stop offering some cover, a policy can become unavailable in practice even when it still exists on paper. [8] [9] [10]
This is why the protection gap should not be treated as a simple target to push towards 100%. Not every loss is insurable at a price that households can pay, and not every asset should be rebuilt in the same place after repeated damage. Insurance can transfer and pool financial risk; it cannot substitute for flood protection, land-use planning, resilient infrastructure or decisions to reduce exposure.
Sources: Eurobarometer 2025: consumer trends in insurance and pension services · Climate insurance protection gaps: a demand-side challenge · Towards a European system for natural catastrophe risk management · Climate change, catastrophes, insurance and the macroeconomy · Policy options to reduce the climate insurance protection gap
Pooling risk can help, but it must reward prevention
The case for pooling is stronger when a single national market struggles to absorb rare, severe losses. EIOPA and the ECB’s 2024 joint paper found that the share of insured natural-catastrophe losses tended to be higher in EEA countries with national insurance schemes: around 47% on average in countries with a scheme, compared with below 18% in countries without one. Eight EEA Member States had established a national scheme at the time of the paper. This is a descriptive comparison, not proof that the schemes alone caused the difference; countries differ in hazards, insurance markets, public institutions and the kinds of cover they provide. [9]
The same paper proposed two complementary European-level pillars. One was an EU public-private reinsurance scheme that would pool private risks across countries and perils, funded by risk-based premiums from insurers, reinsurers or national schemes. The other was an EU public disaster-financing fund to help rebuild public infrastructure after natural catastrophes, financed by Member States. Crucially, access to the public fund would be linked to prior risk-mitigation measures, so that public support did not reward avoidable exposure. These were policy proposals in the 2024 paper, not a description of a scheme already operating. [9]
A workable system would need several layers rather than one universal promise. Private insurance can remain the first line for risks that can be priced and pooled. Reinsurance and capital-market instruments can help spread rarer losses beyond individual insurers. National pools can cover risks where a purely private market leaves too many households or firms exposed. Public financing can prepare for the residual costs of major disasters and for public infrastructure that ordinary property insurance does not cover. European pooling may add diversification, but it cannot make a continent-wide hazard disappear or guarantee that every event will be cheap to insure. [9] [11]
The design conditions matter as much as the size of the fund. Public support should be predictable before disaster strikes, transparent about who qualifies and linked to credible adaptation: building standards, floodplain management, resilient infrastructure, risk information and, where necessary, limits on rebuilding in places that cannot be made reasonably safe. Targeted assistance can protect households that cannot afford cover without hiding the full risk from everyone else. Policy wording, deductibles and exclusions must also be understandable; a household that believes it is insured but discovers a major exclusion after a loss has not received meaningful protection. [5] [8] [9] [11]
Sources: Technical description — dashboard on insurance protection gap for natural catastrophes · Climate insurance protection gaps: a demand-side challenge · Towards a European system for natural catastrophe risk management · Climate change, catastrophes, insurance and the macroeconomy · Policy options to reduce the climate insurance protection gap
The real test is where the bill lands—and what changes before the next disaster
Europe should therefore measure more than the historical share of losses that insurance covered. It should also ask whether cover is available in high-risk areas, whether households can afford it, how quickly valid claims are paid, whether small firms can resume production, how much bank lending is exposed to uninsured assets and what public liabilities remain after private risk transfer. These measures describe different parts of the same economic system; no single percentage can stand in for all of them.
There is also a limit to what insurance statistics can tell us. Historical losses reflect the assets that were built, the places where people and firms chose to locate, the hazards that occurred and the quality of the records available. Future climate risk may differ from the past. EIOPA itself flags gaps and inconsistencies in historical loss data, while the EEA’s indicator records direct asset losses rather than the full chain of indirect economic effects. Better data is not an administrative extra: without comparable information about hazards, insured losses, exclusions and exposure, public money can be directed towards the wrong risks. [5] [6]
The choice is not between leaving every loss to private insurance and asking the state to pay for everything. A more durable settlement would reduce the damage before it occurs, insure the risks that can be pooled, prepare public financing for the risks that cannot be fully transferred, and make assistance conditional on reducing future exposure. It would protect people from catastrophic financial shocks without pretending that every high-risk location can remain economically viable on unchanged terms.
When the next flood, wildfire or drought arrives, the bill will not disappear because a policy was never purchased or a claim was denied. It will appear somewhere: in household savings, a company’s cash flow, a bank’s loan book or a public budget. The economic question raised by Europe’s insurance gap is therefore not simply who sells the policy. It is who carries the residual loss, how long they carry it, and whether the institutions that share the cost make the next disaster less damaging.
Sources: The Dashboard on Insurance Protection Gap for Natural Catastrophes in a Nutshell · Dashboard on insurance protection gap for natural catastrophes · Technical description — dashboard on insurance protection gap for natural catastrophes · Economic losses from weather- and climate-related extremes in Europe · Towards a European system for natural catastrophe risk management · Climate change, catastrophes, insurance and the macroeconomy · Policy options to reduce the climate insurance protection gap · Nature at risk: Implications for the euro area economy and financial stability