A new climate assessment released as COP31 opened finds that the planet is continuing to store extraordinary amounts of heat. The World Meteorological Organization places global surface warming for January–September 2026 at about 1.47°C above the pre-industrial reference period and reports further records in ocean heat and sea level. The measurements describe different parts of the climate system—and different periods of time. Together, they help explain why the longer-term heat buildup matters beyond any one annual temperature ranking.
A nine-month reading in a run of record heat
The World Meteorological Organization released its State of the Climate Update 2026 on November 9, the opening day of COP31 in Antalya, Türkiye. The central temperature finding is stark: from January through September, the global mean near-surface temperature was approximately 1.47°C above the 1850–1900 average, with an uncertainty range of ±0.13°C. The figure combines nine internationally recognized temperature datasets. It is a measurement of nine months, not a final temperature ranking for the entire year.
WMO compares this partial-year result with full-year anomalies of 1.43°C in 2025 and 1.46°C in 2023; the record full-year value for 2024 was 1.55°C. Those different time windows matter. WMO expects 2026 to rank among the four warmest years, while 2015 through 2026 are on course to be the 12 warmest years individually. The significance is not a contest between adjacent annual rankings. It is the persistence of very high temperatures across an entire succession of years.
Sources: State of the climate in 2026 gives new meaning to phrase “off the charts” · State of the Climate Update for COP31 · This year set to be one of four hottest on record, UN report says
Why the energy imbalance matters more than a single hot year
The update also describes a deeper change: Earth is retaining more energy than it sends back into space. This “energy imbalance” reflects the additional heat trapped as greenhouse gases build up in the atmosphere. The WMO says the imbalance reached its highest observed level in 2025 since monitoring began in 1960. Preliminary observations for January–July 2026 suggest another record, but that seven-month indication is not yet a completed annual measurement.
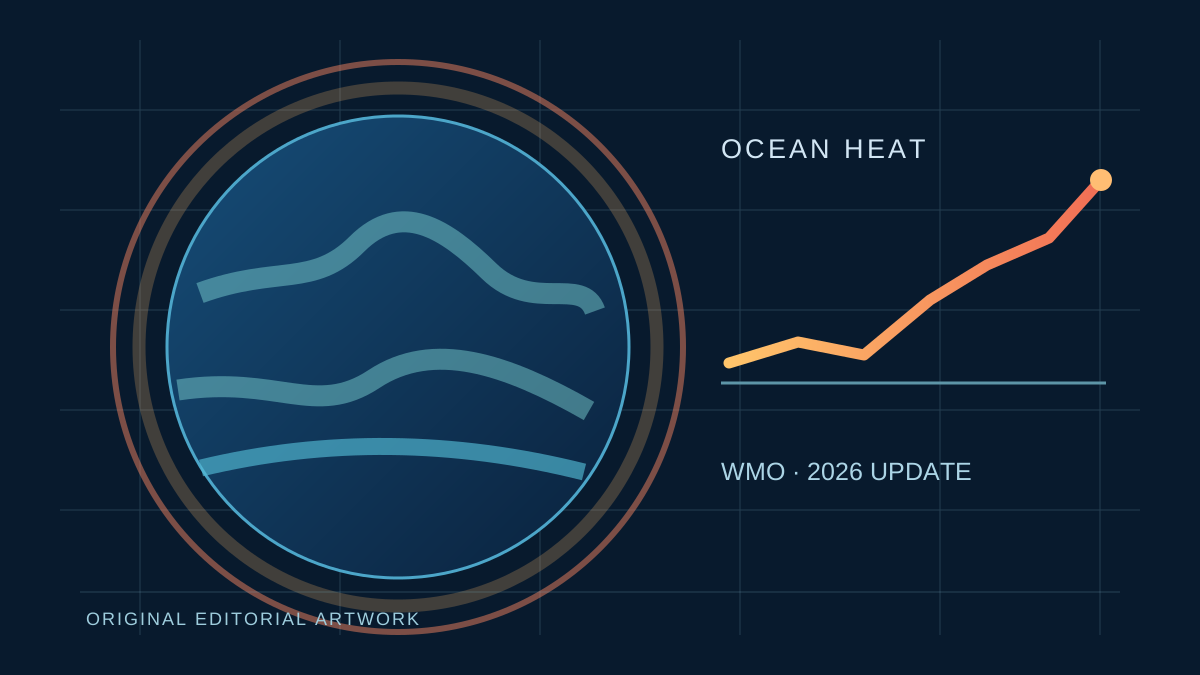
Roughly 90% of the excess heat is absorbed by the ocean. That explains why the climate cannot be understood simply by reading a thermometer above land. Ocean heat content in the upper 2,000 metres reached its observed high in 2025 and continued rising in preliminary data through July 2026. WMO says 2026 is on track to become the tenth consecutive year of record ocean warmth. The stored heat influences marine ecosystems and storms, and can remain in the climate system long after short-term atmospheric fluctuations have passed.
Sources: State of the climate in 2026 gives new meaning to phrase “off the charts” · Ocean Heat Reveals Earth’s Energy Imbalance
The ocean signal is visible in higher seas
Global mean sea level reached a record high during 2026, according to WMO. Its June, July and August values were the highest for those months in the satellite-altimetry record, which began in 1993. Two long-term forces are at work: seawater expands as it warms, and glaciers and ice sheets add water as land ice melts. The newest readings also contain shorter-term variability associated with circulation and rainfall patterns.
WMO cautions that a sharp recent increase may partly reflect the developing El Niño, including changes in where rainfall falls in the tropical Pacific. This does not negate the longer-running upward trend. It means that individual monthly peaks and the multi-decade rise should not be treated as the same statistic. Warmer oceans and higher seas can magnify the consequences of coastal flooding and marine heat events, but the global average cannot by itself predict how much water will rise at any particular shoreline.
Sources: State of the climate in 2026 gives new meaning to phrase “off the charts”
Greenhouse gases and the changing water cycle
The physical drivers are moving in the same direction. WMO reports that globally averaged atmospheric concentrations of carbon dioxide, methane and nitrous oxide all reached record levels in 2025. Carbon dioxide was approximately 426.8 parts per million, compared with around 278 parts per million in 1750. Methane was about 1,948 parts per billion and nitrous oxide about 339.1 parts per billion in 2025. These are concentration measurements for 2025, not an inventory of emissions during 2026.
The assessment also finds continuing deterioration in several other parts of the Earth system. Glaciers lost more than 400 gigatonnes of ice in 2025, while terrestrial water storage has declined globally since 2014. In 2025, 42% of the assessed land area had below-normal terrestrial water storage, compared with a long-term reference share of 25%. Such indicators are not interchangeable: a glacier mass balance, a water-storage anomaly and an atmospheric greenhouse-gas concentration describe different processes. Their convergence, however, illustrates the breadth of changes underway.
Sources: State of the climate in 2026 gives new meaning to phrase “off the charts”
El Niño may amplify the heat, but it did not create the trend
The update arrives as a very strong El Niño develops in the tropical Pacific. WMO says the event has intensified since August and projects that it may reach record strength by December, with effects extending into 2027. El Niño can release heat already stored in the ocean into the atmosphere and shift patterns of rainfall, heat and drought. WMO typically associates the phenomenon with an increase of around 0.1°C–0.2°C in annual global mean temperature, although the effect depends on timing.
That distinction is essential. El Niño does not replace the long-term influence of human-caused greenhouse-gas warming; it alters how heat already within the climate system is distributed. Because this report mainly draws on observations available through September, it does not include the most recent impacts of the strengthening event. WMO expects the complete-year temperature anomaly to be higher than the January–September average, but that remains an outlook rather than a measured full-year result. The final annual report is due in March 2027.
Sources: State of the climate in 2026 gives new meaning to phrase “off the charts” · State of the Climate Update for COP31 · This year set to be one of four hottest on record, UN report says
What the new observations mean for climate protection
Numbers in the update are not just remote scientific benchmarks. Greater ocean heat raises the background conditions for some dangerous weather, while rising seas leave less margin for coastal communities. WMO identifies extreme events as sources of human and economic losses, and says stronger observation networks and forecasts are essential for reducing risks. Early warnings cannot prevent a storm or heatwave, but timely information can improve decisions about shelter, water, health care and evacuation.
The number of countries reporting a multi-hazard early-warning system rose from 56 in 2015 to 136 in 2025, according to WMO. Reporting that a system exists is not the same as verifying that everyone receives or can act on its alerts. Likewise, the January–September warming figure should not be presented as formal proof that the Paris Agreement’s long-term 1.5°C goal has been breached: a temporary or single-year average is a different measure from sustained warming over decades. The larger message of the November update is a planet still accumulating heat, alongside an urgent need for both lower emissions and better protection against risks already unfolding.
Sources: State of the climate in 2026 gives new meaning to phrase “off the charts” · State of the Climate Update for COP31 · This year set to be one of four hottest on record, UN report says