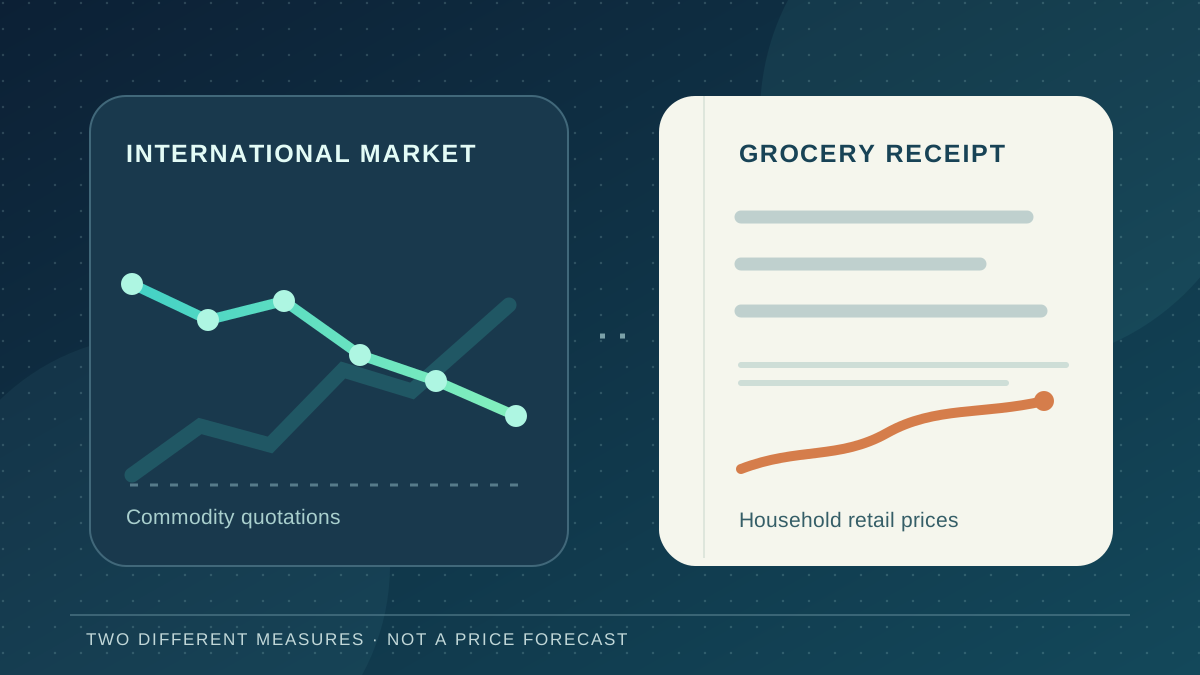
World food commodity prices edged lower in October, but the decline says little about what a household paid at the checkout. The United Nations Food and Agriculture Organization reported a 1.2% monthly fall in its international food-price index on November 6. The actual October reading was 133.9 points, not the lower figure circulating in some summaries. Sugar and vegetable oils rose while cereals, dairy and meat fell. To judge grocery bills, readers need national consumer-price data, which cover different goods and are often released on a different schedule.
The global index moved down; the checkout price is a different measure
The October reading was 133.9 points, down 1.6 points, or 1.2%, from a revised September level, according to the Food and Agriculture Organization. That is a decline in an index of internationally traded food commodities, not a measurement of what shoppers paid at supermarkets in October. It also leaves the overall measure 5.9% higher than in October 2025. A monthly decrease and a higher annual price level can coexist without contradiction: the comparisons refer to different starting points.
The distinction matters because the index combines five commodity groups using weights tied to their international export shares in 2014–2016. A household basket has different weights, and groceries include processing, packing, transport, refrigeration, wages, rent, taxes and retailer margins. A cheaper quoted tonne of wheat is not the same transaction as a purchased loaf of bread. Nor do identical wholesale changes reach every country when exchange rates, duties and local harvests differ.
Sources: FAO Food Price Index · World food prices dip in October, but remain higher than a year ago
Three groups declined, while sugar and vegetable oils rose
Cereals made the sharpest downward move among the five FAO groups, falling 4.5% from September. Dairy fell 1.1%, and meat declined 1.2%. That pattern is materially different from a claim that every basic food became cheaper. Some quoted dairy products continued to strengthen even as the aggregate group index slipped; FAO reported lower butter and cheese quotations outweighing increases in milk powder prices. Meat prices also differed by product and origin, with poultry quotations broadly stable.
The two rising groups are just as important to anyone interpreting the headline. Vegetable oils edged up 0.3%, with gains for soybean and sunflower oils outweighing cheaper rapeseed oil. Sugar jumped 6.6% in a fourth consecutive monthly rise and was 28.8% higher than a year earlier, according to FAO. The agency connected the sugar increase to rain-related interruptions in Brazil and concerns about production elsewhere. Thus even inside the international commodity basket, the word “fell” describes a weighted average rather than a universal direction.
Sources: FAO Food Price Index · World food prices dip in October, but remain higher than a year ago
Grain supplies improved, but trade and weather risks remain
FAO linked weaker wheat quotations to subdued import demand and improving production prospects, particularly in Argentina. Maize prices also eased after their September strength as the United States harvested and exporters in South America looked well supplied. Expectations of fewer constraints on Black Sea shipping added pressure, though FAO explicitly warned that logistical disruption had not disappeared. Rice moved differently: its separate international price index rose 1.6% amid harvesting delays and adverse weather in some exporting countries.
A second FAO release puts the price change in a wider market setting. It forecast 2026 global cereal production at 2,999 million tonnes, below the previous year’s record yet the second-highest on record. It also projected world cereal trade in 2026/27 to contract 3.3% to 507.7 million tonnes. Those are forecasts rather than harvested totals or completed trade shipments. Ample output can put downward pressure on international quotations while transport bottlenecks and regional availability still prevent an equivalent reduction in local retail prices.
Sources: FAO Food Price Index · FAO Cereal Supply and Demand Brief
The evidence from household inflation is older, local and less uniform
The latest available United States national consumer-price release on November 6 covered September, not October. The Bureau of Labor Statistics reported that prices for food at home were 1.8% higher than a year earlier, although the category fell 0.1% from August on a seasonally adjusted basis. This is a useful example of why the time horizon must be stated: a small monthly reduction did not erase the increase over twelve months. The October US consumer-price release was scheduled for November 10, so an October grocery-inflation number should not be treated as already published.
Eurostat had an October flash estimate, but for the euro area rather than the whole European Union and for a combined category of food, alcohol and tobacco rather than groceries alone. That category was estimated to be 1.6% higher year on year, compared with 1.3% in September. It is not an interchangeable measure with the FAO index or with the US food-at-home category. Argentina’s statistics agency similarly listed September as its latest national consumer-price observation, showing a 1.9% monthly increase in the overall index; its October report was scheduled for November 12. None of these releases supports an invented cross-country table of October grocery rates.
Sources: Consumer Price Index News Release · Euro area annual inflation up to 4.0% · Índice de precios al consumidor · Schedule of Selected Releases for November 2026
Why a wholesale retreat may take time to reach a shopping basket
Food moves through several markets before reaching a shopper. Commodity prices often refer to internationally traded inputs: grain delivered to commercial buyers, oil sold in bulk or meat entering export channels. Retailers sell many processed and packaged products under supply contracts that may have been negotiated earlier. The costs of milling, baking, cold storage, domestic freight and labour do not automatically fall when an export quotation eases. A weaker domestic currency can also make imported food more expensive even if its price in dollars declines.
The route from global quotations to local shelves is therefore a transmission process, not an instant conversion formula. Competition and contract renewals may eventually pass along some savings, but a one-month FAO movement cannot establish when that will occur or how much consumers will receive. It also cannot establish whether a particular household pays less: people buy different amounts of bread, meat, fresh produce and cooking oil, and their expenses depend on place and income. FAO itself directs users seeking national wholesale or retail evidence to separate food-price monitoring resources.
Sources: FAO Food Price Index · Consumer Price Index News Release · Índice de precios al consumidor
The next useful test is a sequence of prices, not one headline
For consumers, the immediate question is not whether an international average slipped in October but whether their own food costs are easing compared with last month and last year. That requires country-specific consumer indices and, where available, observed prices for individual foods. The pending US October CPI release and Argentina’s October publication will add information, but neither should be anticipated as a verified result. Eurostat also identified its October estimate as preliminary, with fuller data to follow later in November.
For the commodity market, the next releases will show whether weaker cereal quotations persist, whether sugar’s weather-related strength moderates and how trade disruptions affect what exporters can actually deliver. FAO cautions that recent meat-index readings incorporate projected as well as observed quotations and may be revised. Those limitations are part of the story, not an obstacle to understanding it. October brought a genuine drop in the international headline index; it did not demonstrate that grocery bills dropped with it. The responsible conclusion stops at that boundary until national retail evidence catches up.
Sources: FAO Food Price Index · FAO Cereal Supply and Demand Brief · Consumer Price Index News Release · Euro area annual inflation up to 4.0% · Índice de precios al consumidor · Schedule of Selected Releases for November 2026